| You are herei: Antarctic Precipitation Today is: 02-05-2024 | sei il visitatore numero: 4268 | |
 |
| You are herei: Antarctic Precipitation Today is: 02-05-2024 | sei il visitatore numero: 4268 | |
|

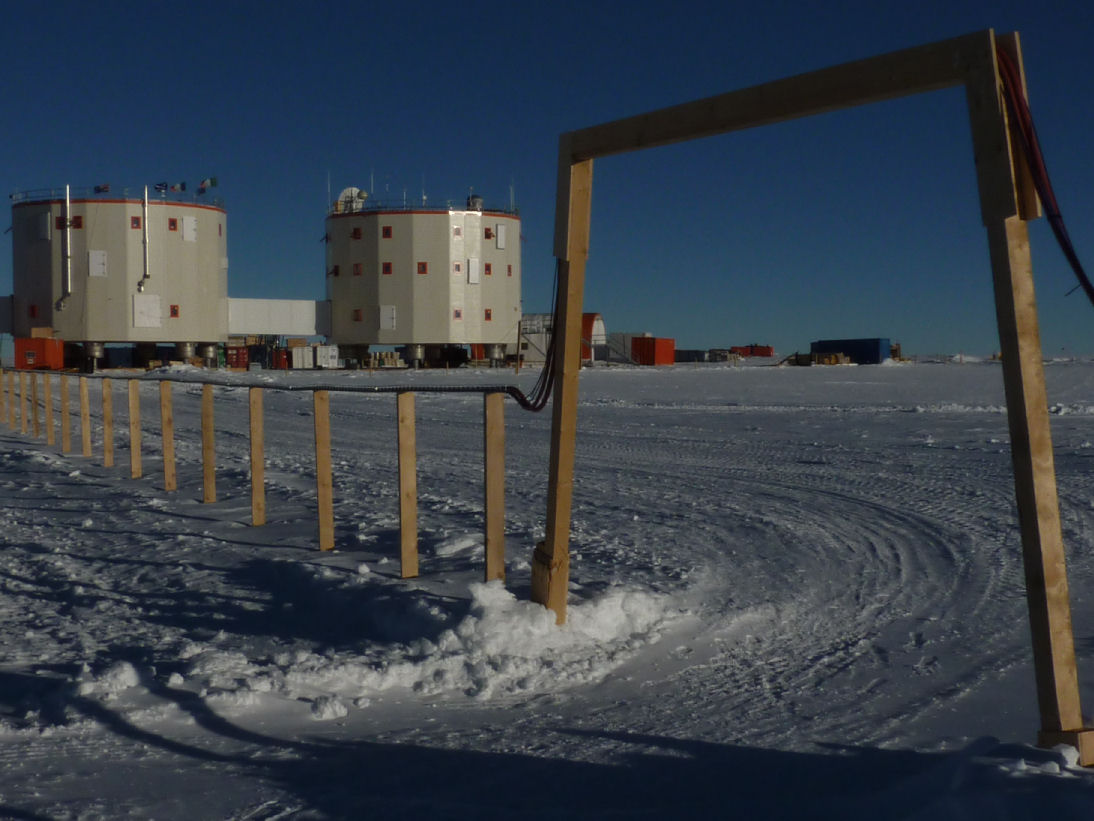
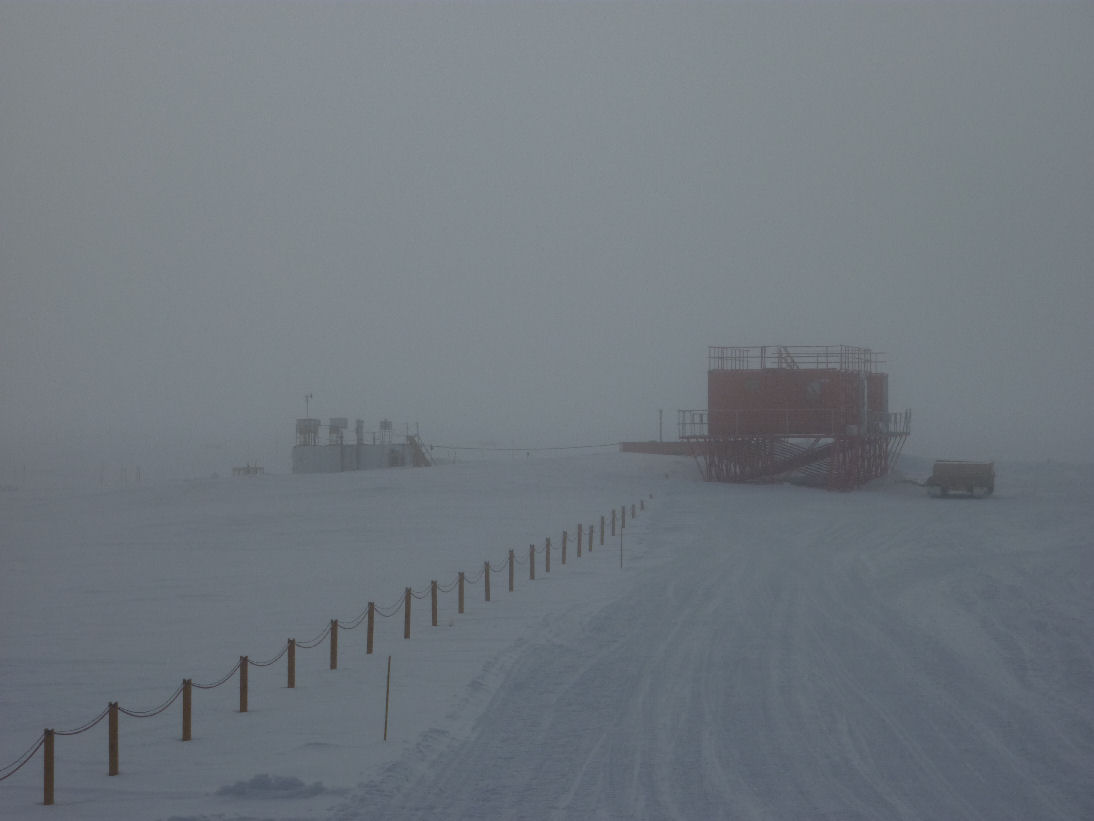
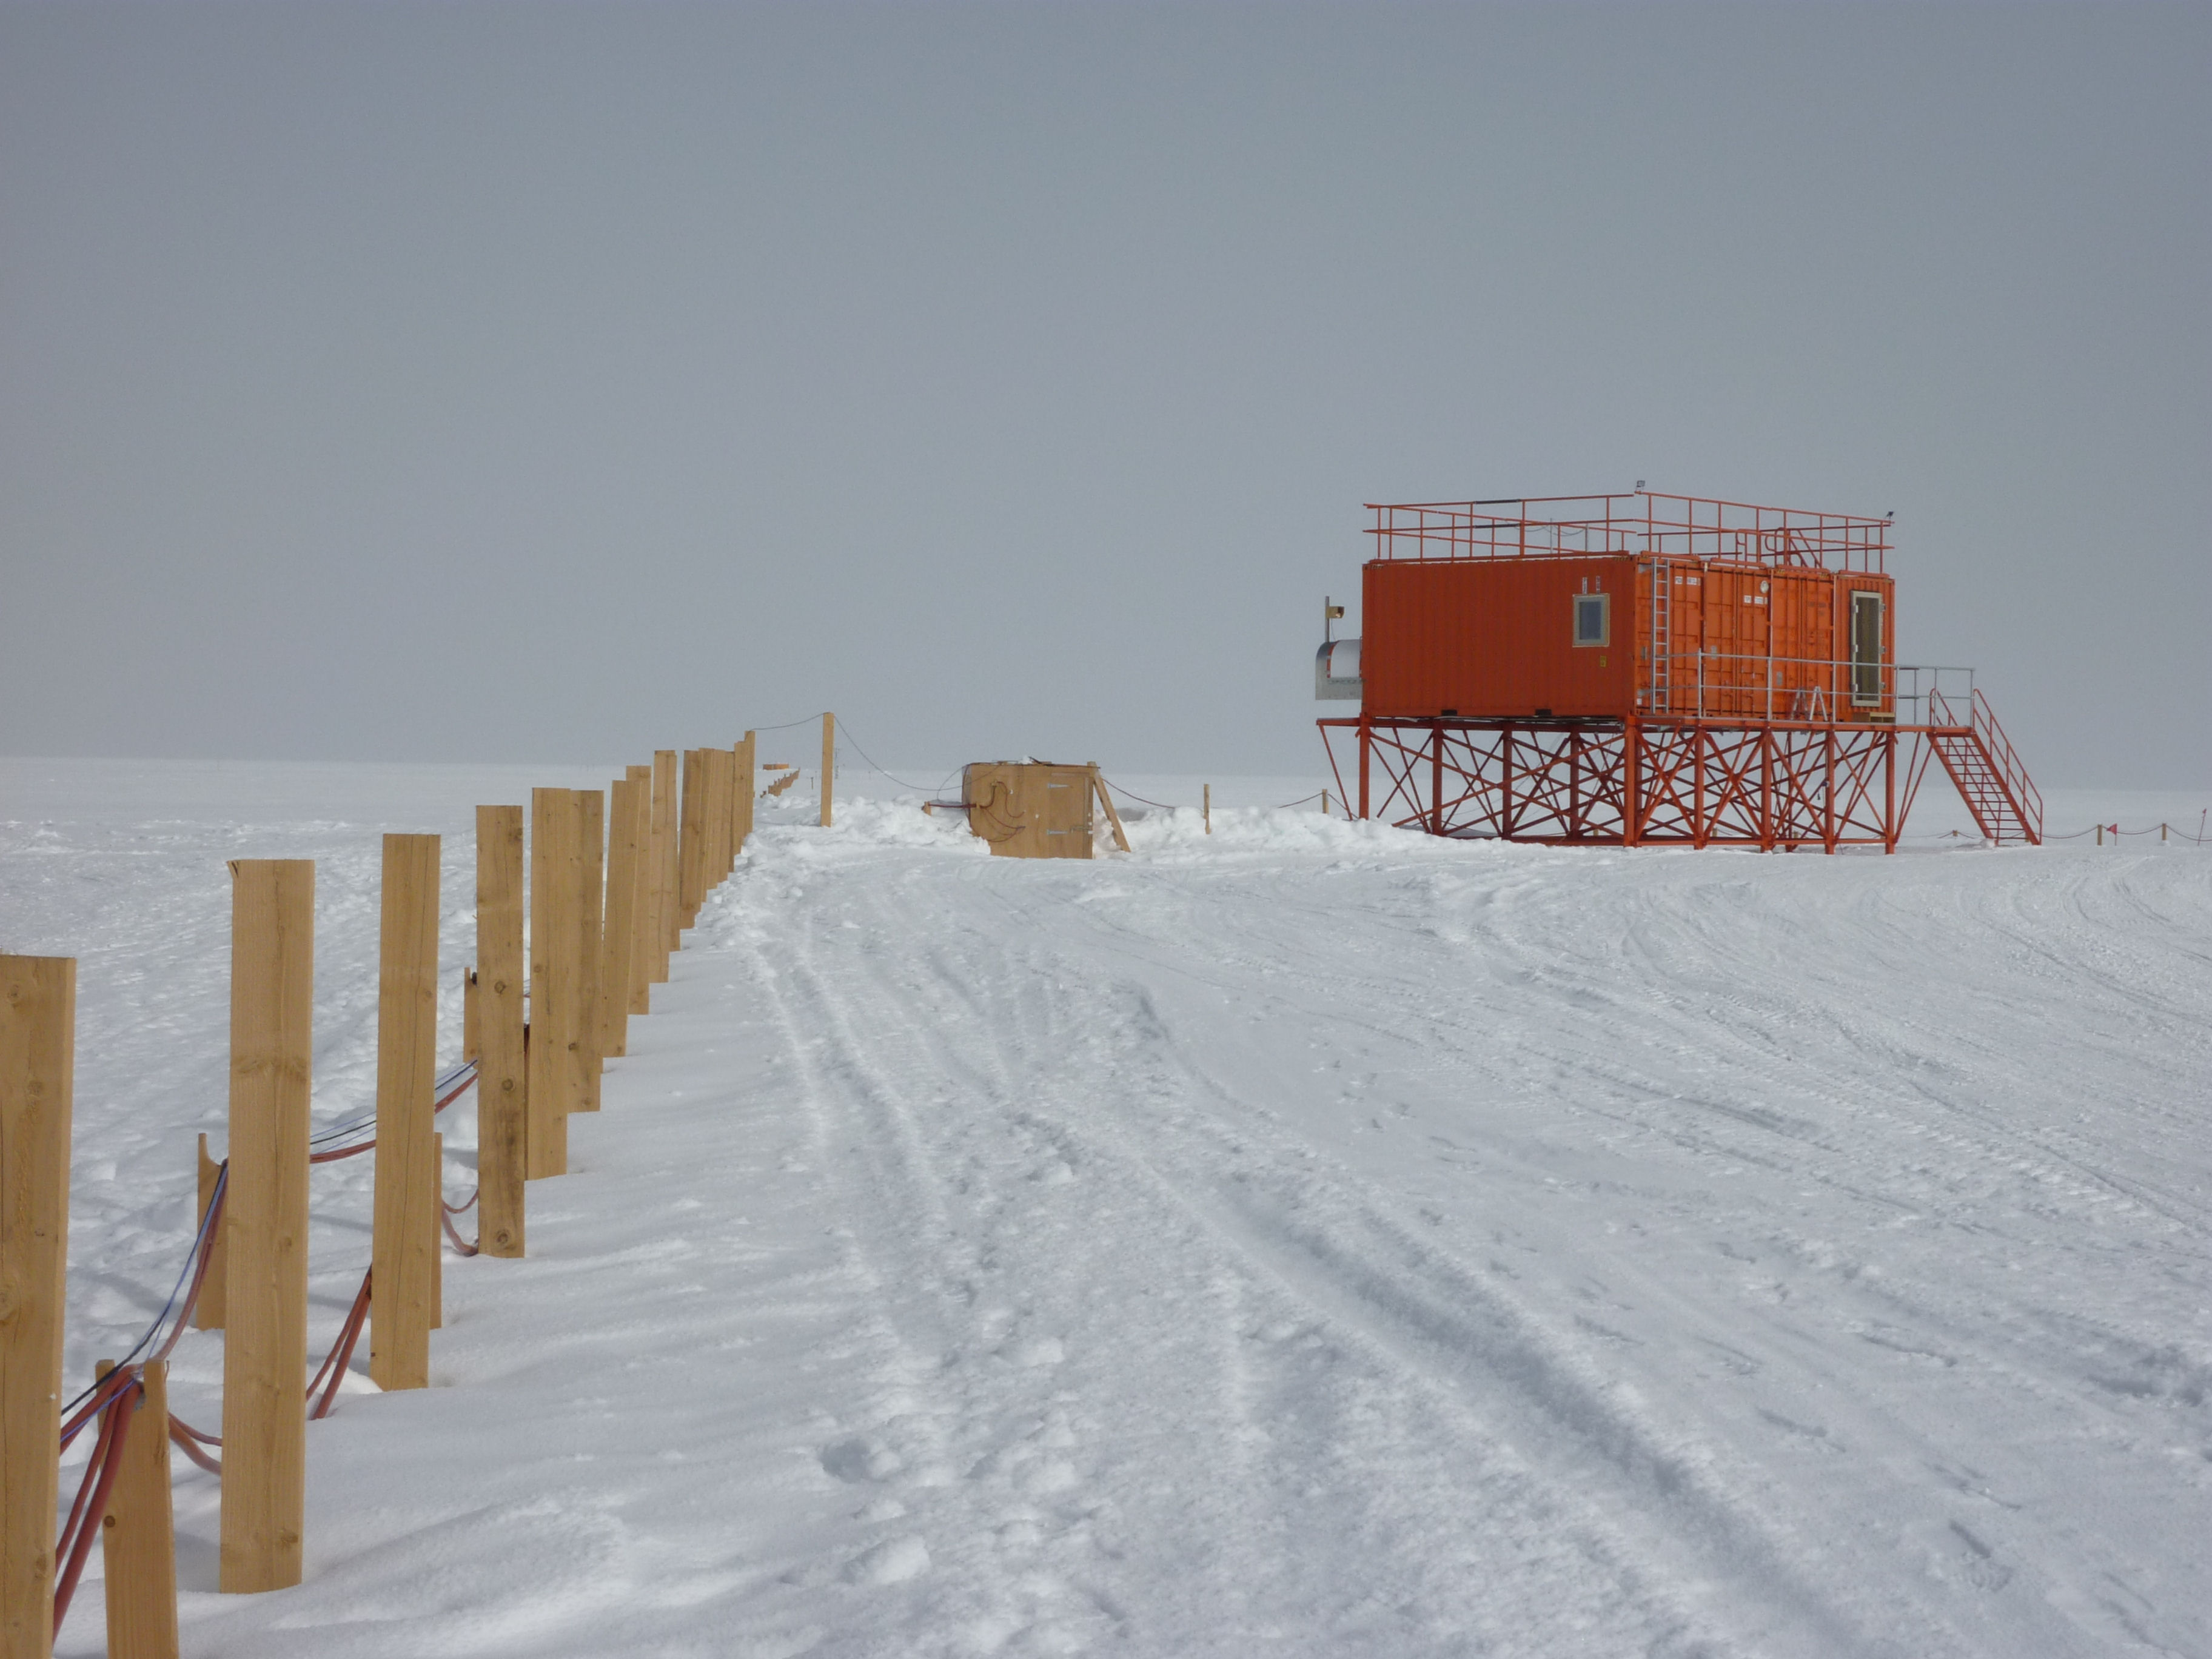
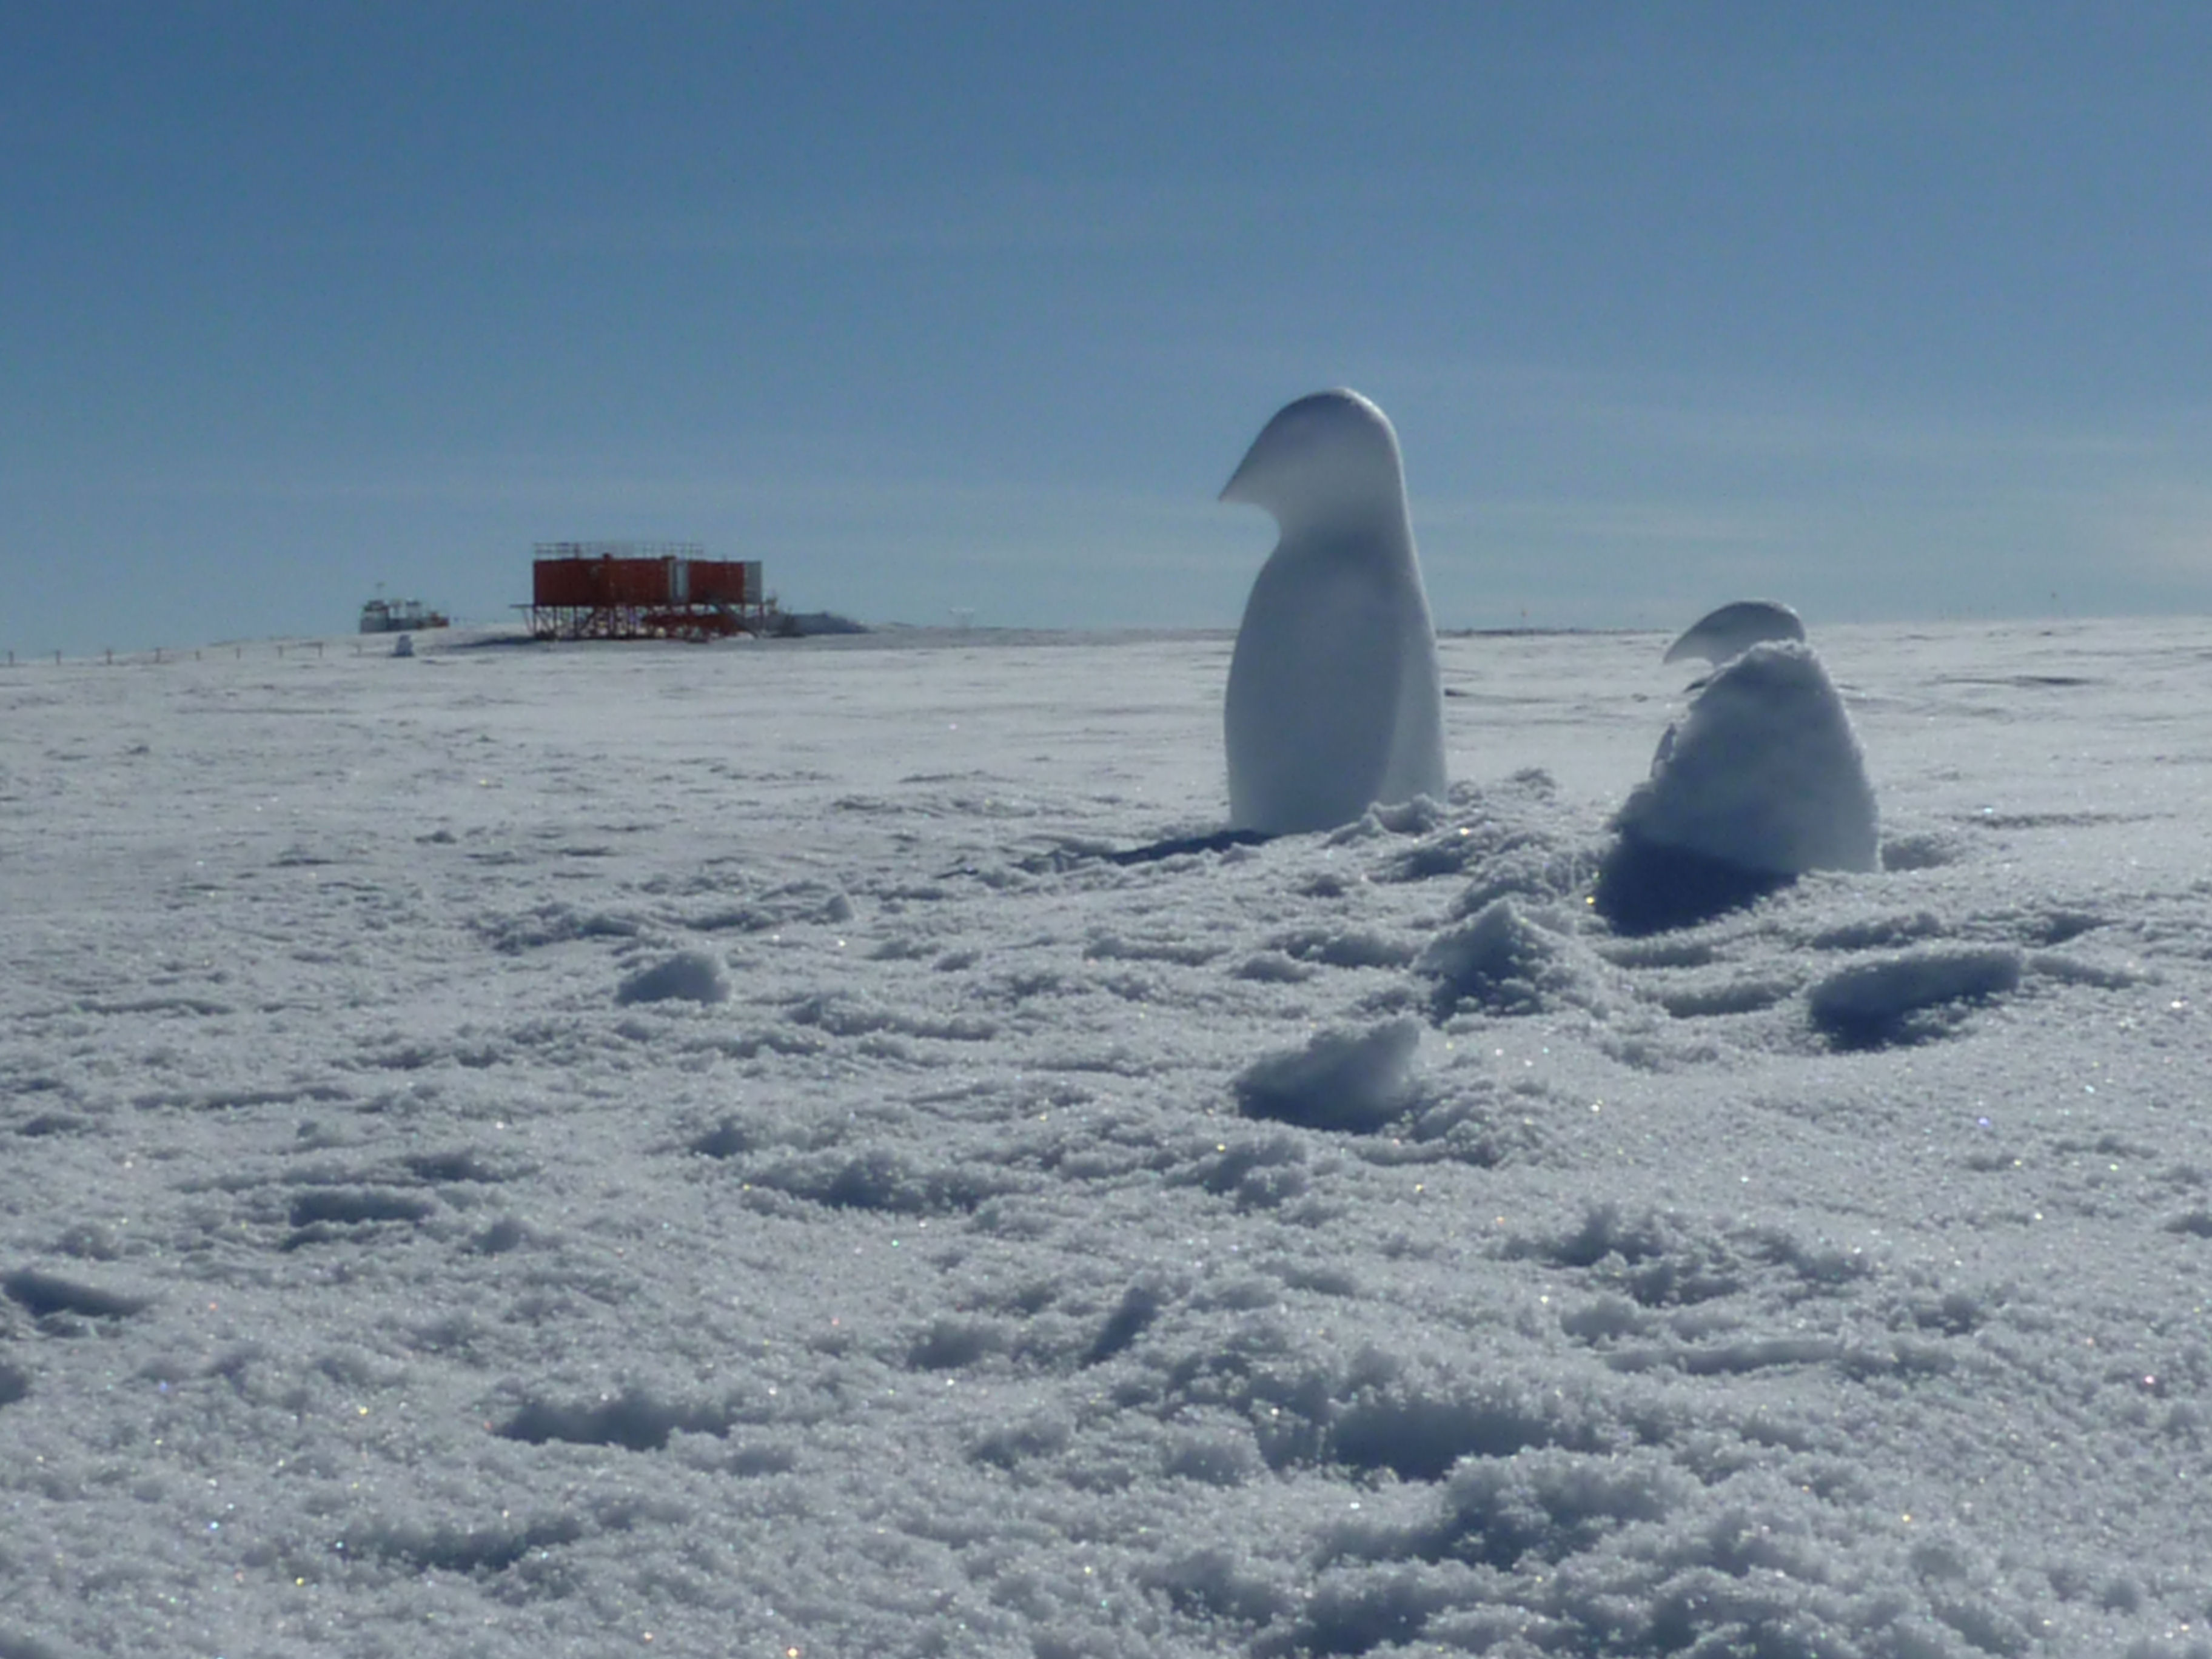
ICE-CAMERA: A new instrument for the study of Antarctic precipitationThe idea for this instrument comes from SCAN-CAMERAS used for atistic photography. The SCAN CAMERA called The instrument was developed and used in the frame of the National Projects PNRA ICE-CAMERA & PRE-REC . ICE-CAMERA operates automatically, by taking a picture every hour of the snow accumultad over a glass plate. The instrument is located on the roof of a new shelter, located 600 meters from the main Concordia buioldings.
|
What is ICE-CAMERA?
|
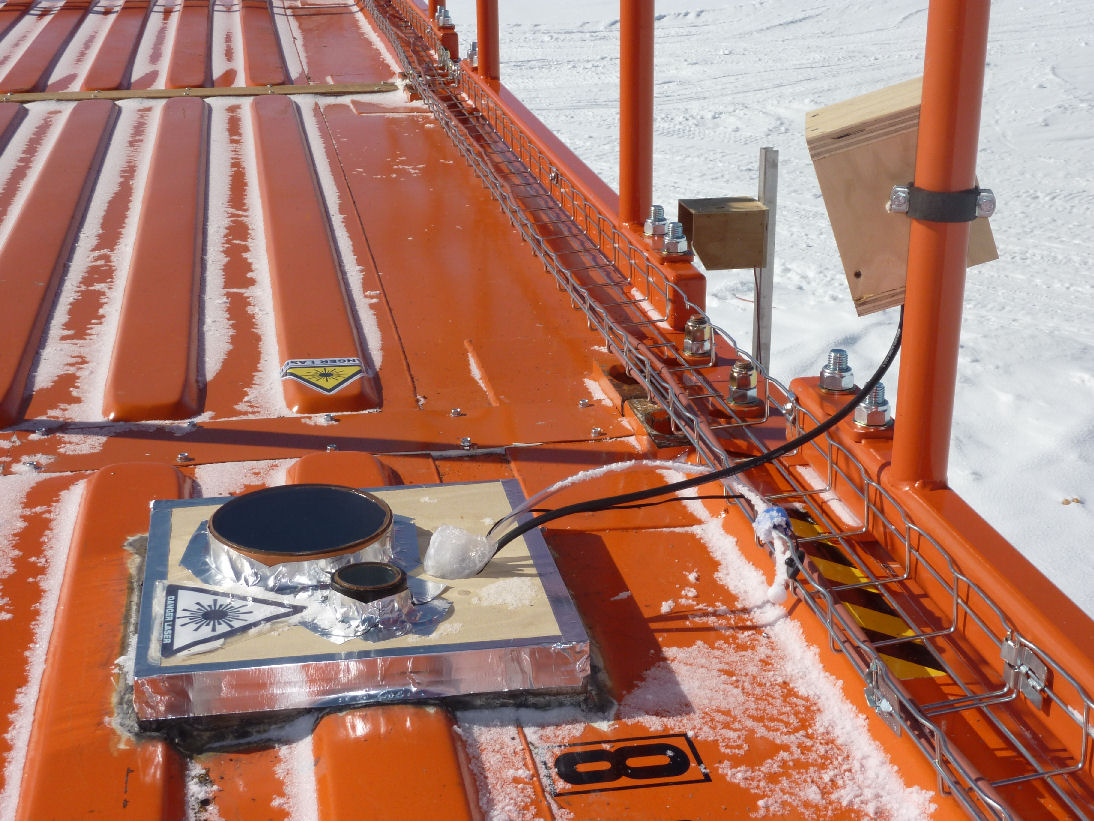
ICE-CAMERA is equivalent to a flatbed scanner. It was built in order to operate unattended in polar regions for the study of ice precipitation ICE-CAMERA collects precipitation on a glass plate, and every hour it takes a scan photo of it, with 5 um resolution... The full description is in this ACP paper . ICE-CAMERAon the roof of the "Physics" shelter , Dome C
Each image acquired by ICE-CAMERA (>700 Mb size) is immediately processed by means of a MATLAB software developed at INO. Every ice grain is identified and measured. Several shape parameters are measured and all information for each grain are saved into daily text files. A 'collage' photo collecting all the grains, sorted by size, is also produced. On the basis of a previous training of the software, a simple classification of each grain is also attempted as shown in the next pictures. At the end of each scan, the glas plate used to collect precipitation is heated in order to sublimate the grains and prepare the plate for a new collection of precipitation. The ICE-CAMERA operates at -20°C inside the case, while external temperature can fall down to -80°C in the antarctic winter. At present it is the only instrument capable of measuring and analyzing the shape of ice precipitations in Antarctica, as far as I know. A sketch of the instrument
|
The data processing flow chart |
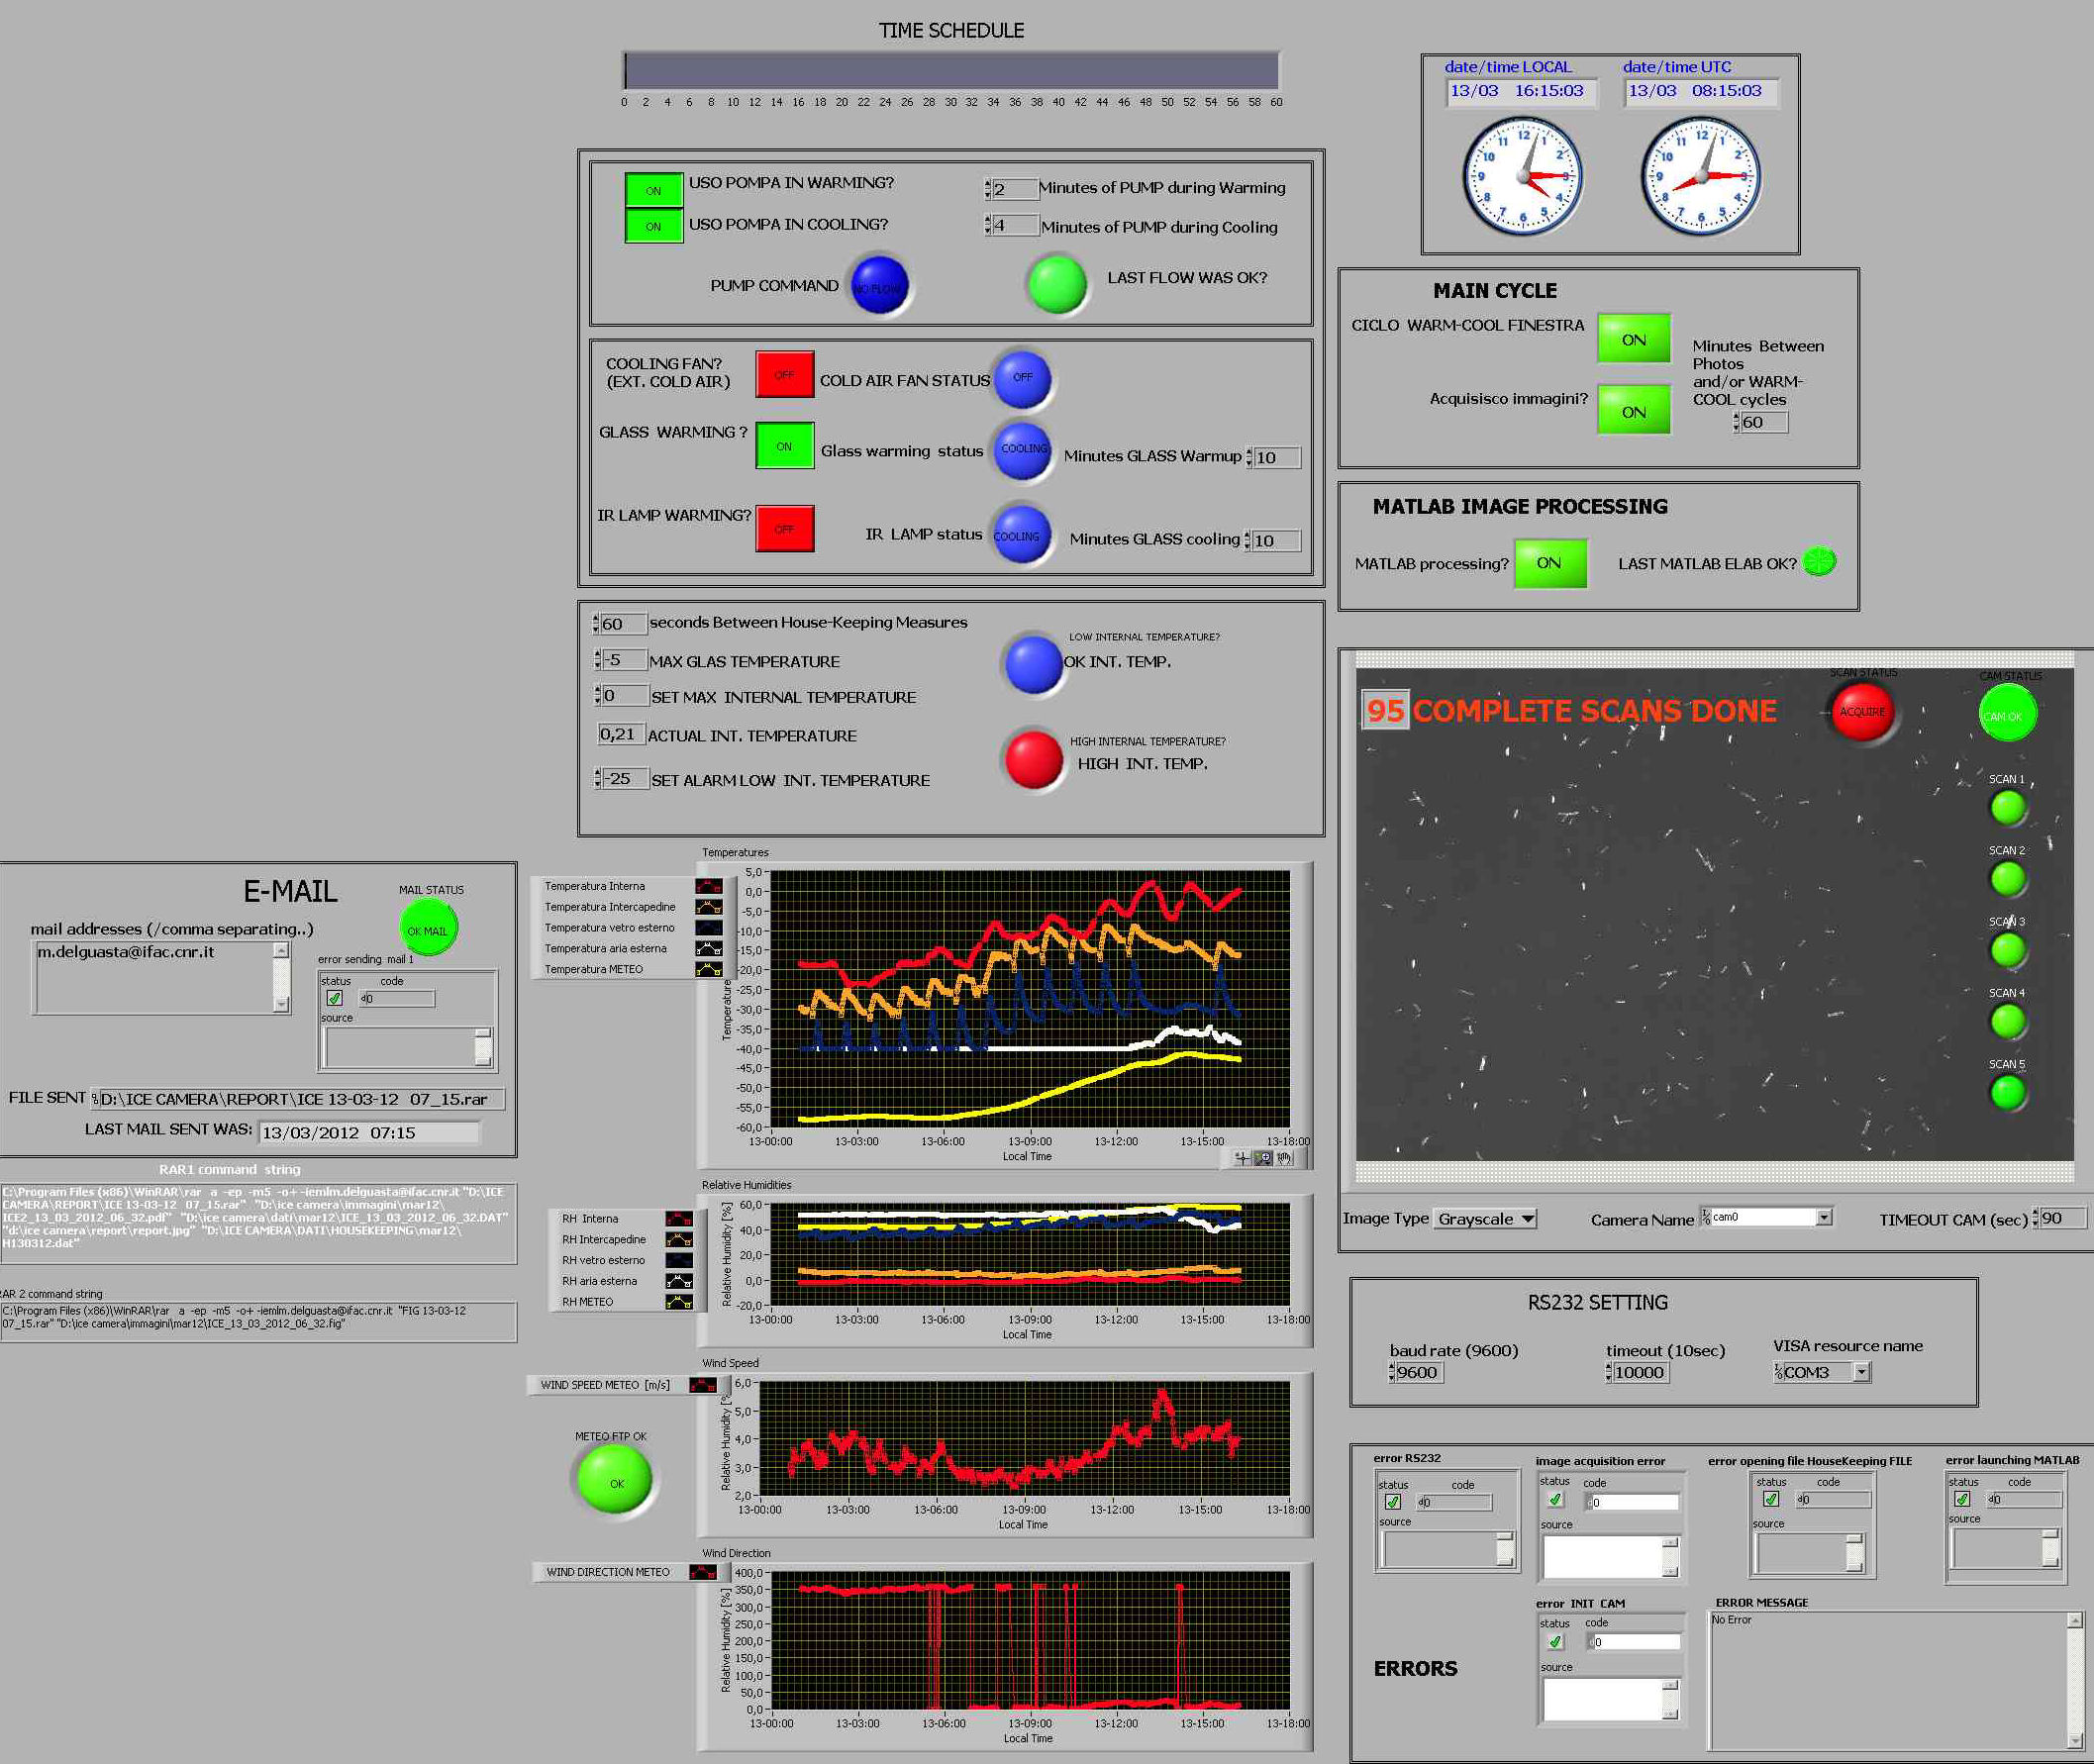
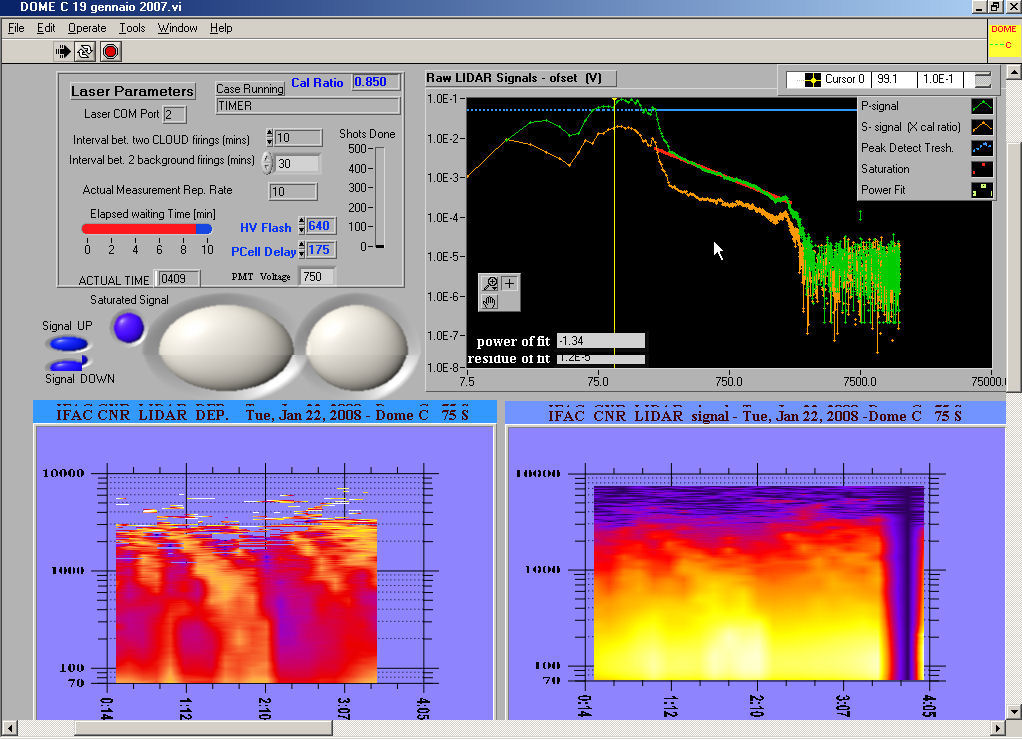
Every hour, the PC GUI of the ICE-CAMERA software (LabView NI) is sent to INO for a check of the health of the system: at present the internet connection of Concordia is not sufficient for a remote control of ICE CAMERA, otherwise possible.
Example of GUI report, sent to Italy every hour
|
Two examples of ice precipitation as captured by ICE-CAMERA In the firs case ROSETTESdominated, while in the second case also HOLLOW COLUMNS were common ...........please explore the images with the mouse!! |
WHAT IS CALCULATED FOR EACH CRYSTAL? Once identified an ice grain in the original picture, it is converted into a binary image. The xy distribution of the grain pixels is then analyzed by calculating several shape parameters: The Moments of the xy distribution of pixels of the grain are defined by:
And the central Moments are:
The Normalized, Central Moments are:
On the base of those Moments, Hu introduced 7 Moments which are invariant for translation, rotation and resizing:
Those 7 quantities are calculated in ICE-CAMERA software, together with the following shape parameters: -Eccentricity': The eccentricity of the ellipse that has the same second-moments as the region. The -EulerNumber: the number of objects in the region minus the number of holes in those objects. -The first 25 coefficients of polar Fourier analysis of the perimeter of the grain The above measured quantities create a vector of values for each grain. This vector is compared with a statistics of "training" shapes in order to classify the grain into one of the "training" grain shapes. The entire process here described is automatized. A convolutive neural network (CNN) was trained over 14 selected classes of grains (see figure below). The CNN made it possible the automatic classification of the ICE-CAMERA grains in post-processing .
The grain classes chosem for Dome C
The confusion matrix of the CNN
EXEMPLES OF STATISTICS Alcune statistiche relative al periodo 2014-2021....
Statistics of the Feret Length of the grains for the different , relevant classes (2014-2021 period)
Seasonal trend of the Feret length of the grains for the different , relevant classes (2014-2021 period)
|
|
|
Massimo Del Guasta - National Institute of Optics (INO) - National Research Council | Via Madonna del Piano, 10 - 50019 Sesto Fiorentino - Firenze, Italy | Tel (office): +39-055-5226423 - Tel (laboratory) +39-055-5226424 | Email: Massimo Del Guasta | Web: www.ino.it | sito ottimizzato per una risoluzione minima di 1024x768 e firefox
 BioOptics


